This product has limited availability. Some accessories, replacement parts, or services may still be available when it is no longer available.
概要
For turf grass water management applications, Campbell Scientific’s T.Weather T107 station and Toro’s Central Irrigation and Control System automatically monitor meteorological conditions that affect turf grass water consumption. This information is used by the Central Irrigation System to analyze current irrigation requirements.
続きを読むイメージ

CAD ファイル:
詳細
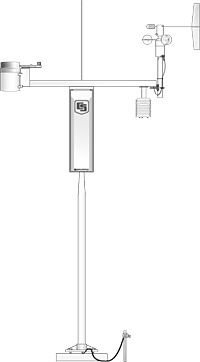
Our T107 station consists of meteorological sensors, an aluminum 3-m pole, and an environmental enclosure that houses a CR1000M module and a 7-Ahr sealed rechargeable battery. The battery is recharged via ac power or a 10-W solar panel. Sealed circular connectors are provided on the outside of the enclosure to simplify sensor hookup.
Meteorological sensors included with the T107 are the CS305-ET Solar Radiation Sensor, HMP60-ETS Air Temperature and Relative Humidity Probe, TE525-ET Tipping Bucket Rain Gage, and either the 034B-ETM Wind Set or WindSonic1-ETM 2-D Sonic Wind Sensor.
Phone or short haul modems are used to transfer hourly weather data between the weather station and a central computer. The central computer calculates ETo and programs each controlling satellite with the appropriate irrigation cycles.
仕様
| -NOTE- |
The T107 has components that have their own specifications. To review these specifications, refer to the appropriate products below: |
互換性
Replacement sensors for the T107 have a -ET or -ETM suffix.
よくある質問
T107に関するよくある質問の数: 4
すべて展開すべて折りたたむ
-
Yes, but the following conditions must be met:
- The station has to use IP communications (through an Ethernet, Wi-Fi, or cellular modem connection).
- The programming on the weather station’s data logger has to be changed to produce the data in the appropriate format and communicate the data to the Weather Underground website.
-
VisualWeather を ET107、T107 (Toro)、ET106、または MetData1 で使用し、ステーションが標準構成である場合、VisualWeather でのステーションの設定は比較的簡単です。Weather Station Network 画面のリストからステーションを選択すると、ほとんどの作業が自動的に実行されます。
ただし、カスタム ステーション、異なるステーション モデル、またはセンサーの 1 つに異なるバリエーションを使用する場合は、ウェザー ステーション ネットワーク設定画面でカスタム ステーションを設定する必要があります。ステーション選択画面で、[Custom] を選択します。
ステーションの詳細を尋ねる画面に従います。次に、VisualWeather はステーションに接続し、データが保存されているステーションのデータ テーブルの名前とフィールドを取得します。これらのテーブルの名前とフィールドは VisualWeather にとって意味がないため、マッピング プロセスを使用して、データ テーブル フィールドを VisualWeather が認識するフィールドと単位にマッピングする必要があります。このマッピングにより、VisualWeather は意味のある画面とレポートを作成できます。
データ テーブルは多くの場合番号で識別され、フィールドはわかりにくいことが多いため、マッピング プロセスがわかりにくい場合があります。カスタム ステーションのフィールドをマッピングするには、Campbell Scientific に問い合わせてサポートを受けてください。
-
To post data on a website, the data from the station needs to be regularly collected and put into a viewable format. Campbell Scientific offers two software options that can perform scheduled data collection: LoggerNet and VisualWeather.
VisualWeather is a simple solution that can be used either to connect to the station and monitor data or to set up scheduled data collection. VisualWeather also has powerful reporting capabilities that can be automated. If desired, the screens and reports can be transferred via FTP to a user’s website. A sample site is available for viewing. Using a mouse, hover over the Logan_Utah field in the upper left corner of the web page to view the reports we have selected to generate.
LoggerNet can also be used either to connect to the station and monitor data or to set up scheduled data collection. LoggerNet has more power and flexibility than VisualWeather, but it requires more time and knowledge to implement. For example, LoggerNet comes with an RTMC development tool to create a screen similar to the one in VisualWeather and display the data, but LoggerNet requires that the user learn how to use the RTMC software. In addition, LoggerNet has the ability to transfer data via FTP, but the transfer needs to be set up as a task and then scheduled with the LoggerNet Task Manager.
-
Campbell Scientific recommends the following maintenance schedule:
- Once a week: check the rain gage funnel, and clean as necessary.
- Once a month: check the solar radiation sensor, and clean as necessary.
- Every 3 months: clean the temperature/RH radiation shield.
- Every 6 months to 1 year: replace the two desiccant packs (pn 4905).
- Every 1 to 3 years: have Campbell Scientific replace the wind speed bearings and reed switch. Request a return material authorization (RMA) number by following the steps listed on our Repair and Calibration page.
- Every 1 to 3 years: replace the relative humidity chip (pn 9598).
- Once every 3 years: have Campbell Scientific calibrate the solar radiation sensor. Request a return material authorization (RMA) number by following the steps listed on our Repair and Calibration page.
- Once every 5 years: have Campbell Scientific calibrate the rain gage sensor. Request a return material authorization (RMA) number by following the steps listed on our Repair and Calibration page.
- Once every 5 years: have Campbell Scientific calibrate the data logger. Request a return material authorization (RMA) number by following the steps listed on our Repair and Calibration page.
Privacy Policy Update
We've updated our privacy policy. 詳細はこちら
Cookie Consent
Update your cookie preferences. クッキーの設定を更新する