Displaying 1 - 20 of 40 articles
著者: Kevin Randall | 最終更新日: 02/17/2026 | コメント: 0
地質専門家(エンジニアおよび地質学者)は、構造物の健全性および地質工学的用途の短期および長期モニタリングに、自動化された現場計測機器をますます使用しています。ほとんどの専門家は、間隙水圧、水位、温度、ひずみ、傾斜、伸長といった一般的な地下および構造物の測定に精通しています。しかし、多くのプロジェクトでは、大気パラメータも補助データとして利用しています(例:降雨量に基づく地滑り危険度モニタリング)。
このような場合、地理専門家は専門分野外のセンサーを選定せざるを得ず、限られた情報に基づいて機器選定を行うこともあります。一方、気象学者は、様々な降水量測定技術の長所と限界を深く理解しています。その結果、降水量は最も多く測定される大気変数の一つであると同時に、最も誤測定されやすい変数の一つでもあります。
この記事では、地質工学および構造健全性アプリケーションに最も関連のある形態である液体の降水に焦点を当てます。
この記事では、以下の内容を取り上げます。 液体降水量の測定方法
標準傾斜バケットを使用する際の一般的なエラーの原因
測定誤差の低減
従来の転倒マスを超えて
センサー比較の概要
精度に影響を与えるその他の原因 液体降水の測定方法
液体の降水量は数世紀にわたって測定されており、目盛り付きの容器を視覚的に監視する単純なものから、液滴のサイズや速度などのパラメータを測定するレーザーベースの降水量計のような複雑なものまで、さまざまな方法で測定できます。
しかし、ほとんどの降水量センサーは、これら2つの極端な例の中間に位置します。今日最も広く使用されているのは、そのシンプルさ、信頼性、そしてメンテナンスの容易さから評価されている転倒枡式雨量計です。
転倒桝式雨量計は、スクリーン付き漏斗で雨水を集め、両面バケツ機構に導きます。片方のバケツが規定の容積まで満たされると、バケツが傾いて空になり、磁気スイッチが作動します。この磁気スイッチの作動は、データ収集システム(データロガー)によってパルスとして記録されます。各傾き(パルス)は、一定の降雨量増分(通常0.01インチまたは0.1mm)に対応します。機構は自動的に排水するため、センサーは最小限のメンテナンスで長期間稼働できます。
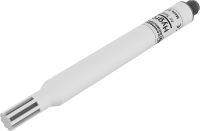
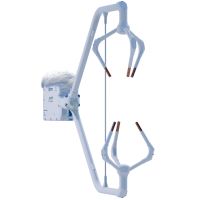
図1は、転倒桝式雨量計の内部に備えられた転倒機構の例です。シーソー型の転倒機構が漏斗の真下の円筒内に収納されていることに注目してください。 図1:左 – RainVue™転倒桝式雨量計の外観(上面図)、右 – RainVueセンサーの内部図
現代の研究により、降水量を測定する最も正確な方法は、集水域が地表と面一になるように装置を地中に埋め込むことであることが証明されています。気象学界では、これは世界気象機関(WMO)の規定に基づき、雨量計ピットとして知られています。
WMO(世界気象機関)準拠の転倒マス式雨量計ピットは、風による雨量不足を最小限に抑えるため、オリフィス縁が地面と完全に一致するように、地中ピットに設置されます。ピットは排水性に優れ、堅固な飛散防止グリッドで覆われています。また、雨量計はピット壁から十分に離れた中央に設置され、雨水の飛散を防ぎます。設置場所は平坦で障害物がなく、近隣の障害物は雨量計の高さの2倍以上離して設置する必要があります。
地中埋設型雨量計は、地上設置型雨量計のような誤差を生じさせることなく降水量を測定できるため、最も精度の高い雨量計です。地上に設置されたセンサーは、センサー周囲およびセンサー上部の気流パターンを変化させ、風の影響で雨量計の捕捉不足を引き起こします。この誤差は、転倒枡型雨量計が地上面に設置されたセンサーと比較して測定精度が低下する2つの要因のうちの1つにすぎません。
ピットゲージは気象学上のベストプラクティスですが、ほとんどの地質工学的モニタリングサイトではほとんど実用的ではありません(まったく実用的ではない場合もあります)。
標準傾斜バケット使用時の一般的なエラーの原因
#1 – 風による漁獲不足
地上のゲージは空気の流れを妨げ、風による漁獲不足につながります。
計器本体の周囲を通過する風は、オリフィス上空に乱流と渦を発生させ、液滴を漏斗から逸らす可能性があります。強風下では、この捕捉不足は最大20%に達することもあり、これは液体降水量測定において最も重要でありながら、最も見落とされやすい誤差です。特に風の強い場所では、中程度の風速でも地上雨量計の測定値に大きなバイアスが生じる可能性があります。
図 2 は、最も一般的な転倒枡式雨量計の概要を視覚的に示しています。 図2:一般的な転倒枡型雨量計の4つの形状 – (a) 従来の円筒形、(b) 漏斗状の上面を持つ円筒形、(c) 水文学研究所で開発された空気力学的(プラスチック)形状、(d) カリックス形状またはシャンパングラス形状とも呼ばれる空気力学的(アルミニウム)形状
図 3 は、標準的な円筒形の転倒ます式雨量計に風が及ぼす影響を示したものです。 図3: 風速10m/s(22mph)における2mmの雨滴の雨滴経路に対するゲージの影響を示す図
大気研究の世界では、一般的な4種類の転倒枡型雨量計の形状に風が及ぼす影響を実証するために、2次元および3次元モデリングが行われてきました。Colli (2018) 1が示したような垂直方向の流れに沿ったカラープロットは、空気力学的雨量計が、標準的な形状の雨量計と比較して、集雨器付近で観測される時間平均の気流パターンに異なる影響を与えることを示しています。Colliは、ほとんどの場合、地上に設置された空気力学的雨量計は、並置された直線状の雨量計よりも多くの降雨量を捕捉すると結論付けています。
#2 – 激しい雨の際の測定不足
強度の高いイベントが発生すると、転倒マスでは以下の理由により降雨の一部を逃してしまう可能性があります。 飛散– 激しい降雨時に転倒機構に流入した水が非常に速く流入するため、転倒が起こる前に無視できない量の水が飛散します。
機械的な傾斜/リセット サイクル中に失われる水– 傾斜機構が一方から他方へ動いている間 (遊び場のシーソーのように)、一時的に水を貯蔵するために利用できる較正済み容量によって捕捉される前に、無視できない量の水が失われます (したがって、測定されません)。 測定不足は完全に排除することはできませんが、降水量が少ない場合や平均的である場合、この損失は最小限に抑えられますが、強度が増すにつれて損失は大きくなります。
測定誤差の低減
風による捕捉不足を最小限に抑えるには: 乱流を引き起こす障害物から離れた、開けた場所にゲージを設置してください
オルタネータタイプのフロントガラスを使用してください。
空気の流れの歪みを軽減する、空気力学的に低いプロファイルのゲージ(Campbell Scientific RainVue 10または20など。後ほど詳しく説明します)を検討してください 高強度の測定不足を減らすには: キャリブレーションと補正アルゴリズムを適用します (これについては後で詳しく説明します)。 激しい嵐が頻繁に発生する地域では、代替の測定技術を検討してください。 これらのアプローチはエラーを減らすものであり、エラーを完全に排除するものではないことを理解することが重要です。
エンジニアリングのポイント:風への露出と降雨量は、センサーの精度仕様と同等以上に重要です。設置場所が風が強かったり、激しい嵐が頻繁に発生したりする場合は、センサーの選定と設置の詳細が重要になります。
従来の転倒桝を超えて
転倒桝は経済的で耐久性があり、導入も容易なため、依然として標準的な選択肢となっています。本質的に捕捉不足や計測不足の影響を受けやすいものの、既知の誤差は用途のニーズに応じて許容できるため、転倒桝はほとんどの用途において依然として有効な選択肢です。しかしながら、プロジェクトのニーズによっては、他の技術にも大きなメリットがあります。 計量計 – あらゆる降水強度と降水タイプに対応
光学センサー...
続きを読む
著者: Aspen Nielsen | 最終更新日: 10/14/2025 | コメント: 0
あなたの周りには、肉眼では見えないものは何がありますか?
この質問を聞くと、最先端の望遠鏡でしか見られない遠方の銀河の画像を思い浮かべるかもしれません。あるいは、特殊なカメラでしか見られない赤外線や紫外線を思い浮かべるかもしれません。理科の授業で顕微鏡を使って観察する微生物を思い浮かべるかもしれません。
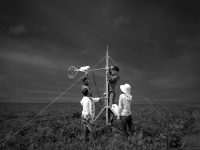
しかし、微気象学者であれば、おそらく地表フラックスを思い浮かべるでしょう。私たちの目には見えないものの、常に存在しています。
フラックスの測定は、センサーを設置して立ち去るほど単純ではありません。現場で働いた経験のある人なら誰でも、小さな見落としがデータの質を左右することを知っています。
これは特にミクロ気象学において顕著であり、渦共分散法などの手法を用いて、地表と大気間のエネルギーや水、二酸化炭素、メタンなどのガスの交換を定量化します。フラックスとは、特定の面積と時間におけるエネルギーまたは質量の移動です。大気中のフラックスは主に様々な大きさの乱流渦によって駆動されるため、測定値は機器の設計に大きく左右されます。たとえわずかな測定誤差であっても、時間の経過とともに蓄積されたり、生データの集中的な処理工程を通じて伝播したりし、最終的に報告されるフラックス値にバイアスが生じる可能性があります。
Campbell Scientificのミクロ気象学主席アプリケーションエンジニアであるエドワード・スウィアテック氏との最近の会話の中で、現在利用可能なセンサーを用いて渦相関観測所の構成を最適化する方法について深く検討しました。このブログ記事では、その検討事項の一部をご紹介します。
ヒント 1: アプリケーションに最も適した渦共分散システム設計を選択します。
あなたのアプリケーションには、オープンパス渦共分散システムとクローズドパス渦共分散システムのどちらが適しているでしょうか?この問いに答えるために、私たちは「状況によって異なる」という悪名高い工学格言を使います。
オープンパス型とクローズドパス型のガス分析装置には、それぞれ異なる利点とトレードオフがあります。以下の表は、それぞれの設計の一般的な利点と欠点をまとめたものです。
メリット
デメリット オープンパス 使いやすい
簡単に導入可能
優れた周波数応答
低電力需要
低コスト 環境汚染の影響を受けやすく、データセットにギャップが生じる
潜在的な流れの歪み クローズドパス 環境汚染を受けにくい
流れの歪みの低減
頻繁な雨や霧でも優れたパフォーマンスを発揮
ガスヘッドを取り外すことなくゼロおよびCO2スパンを実行可能 複雑なインストール
周波数応答が悪い
電力需要の増加
コストが高い ご存知のとおり、渦の大きさは地表からの距離に応じて異なります。 地表付近では、乱流は高周波渦、つまりより小さな渦によって支配されます。オープンパス渦共分散センサーは、一般的に周波数スペクトルの高域で優れた周波数応答を示すため、小さな渦をより正確に測定でき、農地や在来種の草地などの低樹冠生態系に適しています。
スペクトルの反対側、つまり森林の樹冠の上など、大きな渦が支配的な場所では、閉経路の渦共分散システムが理想的である可能性があります。 ヒント #2: 渦共分散測定で真のタイミング精度を実現します。
想像してみてください。素晴らしいコンサートホールに座り、世界クラスのオーケストラの演奏を聴いています。交響曲は弦楽セクションの豊かな音色で始まり、オーボエとトランペットがシームレスに繋がって、それぞれの音符が完璧に調和しています。そしてスネアドラムが加わりますが、一拍一拍が遅れています。途端にハーモニーが崩れ、音楽が…違和感を覚えます。
同様に、渦共分散システムも同時に測定を行う必要があります。渦共分散法はその名の通り、2つの量(鉛直風速とスカラー(温度とガス)の変動)がどのように同時に変化するかを測定します。共分散の大きさはフラックスの強度を表し、符号はフラックスの方向を示します。
同時測定を行わない場合、共分散が過小評価され、フラックスが過小評価され、結果として不正確なデータとなります。同期測定の重要性については、Fratiniら (2018) で解説されています。Swiatek1氏はさらに、「同時測定が不可能であれば、すでにデータは破損している」と述べています。さらに、同時測定を確実に行うには3つの方法があると説明しました。 推奨:共通の電子機器で測定可能な音波風速計とガス分析計を使用します。あるいは、GPS(全地球測位システム)など、時間基準に合わせて継続的に調整できる内部クロックを備えた計測機器を使用します。これにより、測定が実質的に同時に行われることが保証されます。
代替案- データ収集システムからの測定トリガーコマンドをサポートするスタンドアロンの音波風速計とガス分析計を使用します。このコマンドは、ドリフトしやすい機器のクロックに頼るのではなく、両方のセンサーの測定サイクルを駆動します。
最も不利な方法– 独自の内部クロックで動作するスタンドアロンの音波風速計とガス分析装置を、最も高速な測定周波数と出力周波数で使用します。すべてのクロックは時間の経過とともにドリフトするため、これら2つのセンサーからの測定が同時に行われることを保証することはできません。 ヒント #3: 流れの歪みを最小限に抑えるには、水平対称のセンサーを使用します。
渦共分散センサーは乱流を測定します。センサーを現場に設置すると、その存在自体が風速場(平均流と乱流の両方)に影響を与えます。センサー、取り付け金具、そしてタワーによって引き起こされる流れの歪みを軽減する唯一の方法は、乱流センサーを卓越風の方向に向けて設置することです。
現場でのセンサー設置を効率化するには、センサー設計の改良が不可欠です。センサー設計において重要な考慮事項は、Wyngaard (1988) が示唆しているように、超音波分析計とガス分析計の両方において水平対称性を確保することです。水平対称に設計されたセンサー2、は、平均気流を機器の上部と下部に対称的に分割し、センサーの形状に起因する平均気流の歪みを「打ち消す」ことができます。
目に見えないものを測定する
目に見えないにもかかわらず、フラックスは私たちの環境に大きな影響を与えています。フラックスを正確に測定するには、単に機器を設置するだけでは不十分です。センサーの慎重な選定とシステム設計、細部への配慮、そしてシステム内のあらゆるコンポーネントがデータ品質に及ぼす影響を理解することも必要です。
この記事の原則を適用することで、ミクロ気象学者は不確実性を減らし、データの整合性を保護し、地球の表面と大気の間の複雑なやり取りをさらに理解することができます。
私たちの周りの世界をより良く測定すればするほど、より良く理解できるようになります。
当社のミクロ気象学者は、研究者の皆様に可能な限り信頼性の高いデータを提供することに誇りを持っています。ぜひお気軽にご相談ください。専門家が対応いたします。 Credits: Edward Swiatek of Campbell Scientific, Inc. contributed to this article. References
1 Fratini, G., Sabbatini, S., Ediger, K., Riensche,...
続きを読む
著者: Aspen Nielsen | 最終更新日: 08/22/2025 | コメント: 2
気候変動の追跡、洪水の評価、氷河後退の監視、航空機の着陸に関する重要な意思決定など、あらゆる場面で気温データが重要な役割を果たします。気温は、湿度、気圧、風向など、大気や環境の様々な条件に直接影響を与えます。正確な気温測定は、リアルタイムの意思決定だけでなく、長期的な気候監視や科学研究にも不可欠です。
しかし、ここに落とし穴があります。現在、世界中で使用されているさまざまな温度センサーによって不一致が生じており、データの正確性、信頼性、比較可能性に関して疑問が生じています。
このブログ記事では、世界気象機関 (WMO) の温度基準について説明し、これらのガイドラインに準拠するためのエンジニアリング上の課題について説明し、要件を満たすか上回る実証済みのソリューションを紹介して、世界中の温度センサーのベンチマークを高めます。
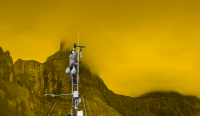
課題:WMOの気温勧告を満たす
国連の世界気象機関(WMO)は、温度センサーを含む様々な環境・気候センサーに関する勧告を策定しました。歴史的に、WMOの温度基準を満たす、あるいは上回ろうとすると、技術的な課題と非常に高いコストが伴いました。幸いなことに、近年の技術進歩により、WMOに準拠した計測が可能になり、アクセスしやすく、手頃な価格になりました。
WMO コンプライアンス基準はなぜ重要なのでしょうか?
正確な気温データは、幅広い測定システム、意思決定、そして政策立案プロセスの基盤となります。地球規模の気候が変化し続ける中、気候科学の発展は、標準化され、追跡可能で、信頼性が高く、正確な高品質なデータに依存しています。
残念ながら、世界中で気象・気候データ用のセンサーの仕様は大きく異なっており、一貫性のないデータから一貫性があり比較可能な数値モデルを作成することはほぼ不可能です。より優れた予測モデルには、より優れたデータが必要です。
高品質なモデルに供給するための高品質なデータが世界的に求められているため、WMOは環境監視システムに関する厳格なガイドラインを制定しました。しかし、市販されている多くの温度センサーは、これらの基準を満たすのに苦労しています。
長年にわたり、幅広い気温と風速範囲において、低い測定不確かさと短い時定数を両立できる温度センサーを見つけることは事実上不可能でした。そのため、研究者たちはWMOの性能期待値、つまりより良いデータを通じて公共の利益に貢献するという基準を満たすソリューションを模索していました。
WMOのガイドラインへの準拠はすべての地域で義務付けられているわけではありませんが、WMOの勧告は気温測定の品質におけるベンチマークとして広く認められています。これらのガイドラインは、気温データの正確性、信頼性、比較可能性、そして科学的堅牢性を確保するための統一基準を策定するための、世界規模の協力的な取り組みを表しています。
WMO コンプライアンス基準 ( WMO-No. 8 1に記載されており、この記事の後半で要約されています) は、いくつかの理由で重要です。 精度とトレーサビリティ– WMO準拠のセンサーは、精度、安定性、校正トレーサビリティに関する厳格な推奨事項を満たしています。これにより、特に過酷な条件下での測定の不確実性が低減されます。
地球規模のデータ比較可能性– WMOの標準規格は、世界中で測定されたデータの比較可能性と一貫性を確保します。標準化手法とセンサー仕様がなければ、ある観測所の気温データが他の観測所と整合しない可能性があり、地域的または地球規模の傾向を評価することが困難になります。
気候・気象記録の品質管理– 気候の理解、モデルの検証、政策立案の支援などに用いられる長期気候データセットは、高品質で標準化された観測データに依存しています。WMOの基準への準拠は、これらの記録の完全性と信頼性を確保するのに役立ちます。
現実世界の条件に合わせて設計– WMO 標準では、実験室条件だけでなく、環境耐久性を確保するために実際の展開要因が考慮されています。 結局のところ、WMOのコンプライアンスは単なるラベル表示にとどまりません。測定が最も重要となる場面において、耐久性、信頼性、そして精度を確保することが重要なのです。
WMO 準拠の温度センサーに関する技術的な推奨事項は何ですか?
WMOの基準を満たすには、温度センサーはWMO-No. 8第2章に記載されている特定の基準を満たす必要があります。概要は以下のとおりです。 温度センサー機能
WMO 基準 測定の不確かさ
±0.1°C 以上 測定範囲
-80° ~ +60°C 校正
国内/国際基準にトレーサブル 時定数
≤20 秒 WMO-No.8の発表後、WMOは補足的な機器及び観測方法に関する報告書(IOM 136)を作成し、基準をさらに明確化しました。IOM 136は、気温測定の「達成可能な精度」の許容範囲を±0.2℃以下に定義しました2。可能達成可能な精度とは、外部要因を考慮した上で、高品質の機器と手順を用いて実際に達成できる精度を指します。
正確な温度測定の核となるのは、WMO(世界気象機関)が達成可能な精度の推奨事項を満たすか、それを上回るセンサーです。適切に管理された設置環境であっても、現実世界の様々な要因によってセンサーの小さな誤差が加わり、測定全体が±0.2℃の許容範囲を超えてしまうリスクがあります。そのため、±0.1℃の仕様を満たすかそれを上回るセンサーを慎重に選定し、特に適切な設置と高品質で互換性のある放射線シールドを使用することで、WMO IOM 136の±0.2℃の達成可能な不確かさに関する推奨事項を満たすか、それを上回る可能性が大幅に高まります。
規格に適合したセンサー
WMOの推奨値を満たす、あるいはそれを上回る手頃な価格で市販されている温度センサーを見つけることは、長年の課題でした。この課題に対処するため、Campbell ScientificはWMOの基準を満たす2つの先進的なセンサー設計、TempVue™10とTempVue™20を発表しました。 両方の TempVue モデルはスタンドアロン センサーとして WMO 規格を満たし、TempVue 10 では -80° ~ +60°C、TempVue 20...
続きを読む
著者: Aspen Nielsen | 最終更新日: 07/16/2025 | コメント: 0

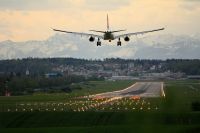
航空専門家として、気象の安全性について考えるとき、何が思い浮かびますか?
安全な着陸のために天候の回復を待ちながら、様々な高度で増え続けるフライトを管理することを考えているかもしれません。あるいは、滑走路面に溜まる水によって航空機のブレーキ性能が影響を受けるのではないかと懸念しているかもしれません。最初に何を思い浮かべるかに関わらず、航空安全にとって最も重要でありながら、しばしば目に見えない柱の一つは、信頼できるリアルタイムの気象データです。
調査によると、2012年から2021年の間に国家運輸安全委員会(NTSB)が調査した米国の航空事故11,739件のうち、23.26%が状況、天候、現象に起因するものでした1 。これには、気圧、風、気温、湿度、天井高、視程、降水量、雷、乱気流などの環境要因が含まれます。これらはすべて、飛行の安全性と運用効率に直接影響を与える可能性のある状況です。(詳細については、NTSBの一般航空事故ダッシュボードをご覧ください。)
気象データが必要な理由
空港や航空業界の専門家にとって、気象監視は単なる数字の問題ではありません。人命、資産、そして効率に関わる問題です。離陸時間を決定するパイロット、着陸シーケンスを管理する航空管制官、給油や除氷を計画する地上クルーなど、あらゆる意思決定は正確な気象データによって左右されます。
そのため、信頼性が高く、準拠しており、将来も使用できる航空気象システムへの投資は、ミッションの成功に不可欠です。
AWOS ソリューションとは何ですか?
自動気象観測システム(AWOS)は、航空関連の気象データを監視、収集、配信するために設計されたソフトウェアとハードウェアの融合システムです。このシステムは、人命の安全確保から航空機の保護、効率的な運航の維持に至るまで、意思決定者が適切な対応を取れるよう支援します。
AWOSソフトウェア:データを行動に変える
生データだけでは不十分です。データは解析、処理、解釈され、適切なタイミングで適切な人に届けられる必要があります。AWOSソフトウェアは、次のような重要な役割を果たします。 センサーデータを統合して全体像を把握する
気象レポート(METAR、SPECIなど)の作成と配信
リアルタイム監視の有効化
国際民間航空機関(ICAO)および世界気象機関(WMO)の基準への規制遵守の確保
センサーから通信、人間が入力したデータ、システムハードウェアに至るまで、システム全体の健全性を積極的に監視します。 AWOSハードウェア:センサーとインフラストラクチャ
AWOS フィールド ステーションの中心には、次のような重要な大気条件を測定するセンサー ネットワークがあります。 大気圧
気温
風速と風向
視認範囲
クラウドベース
雷検出
降水量
現在の気象状況
相対湿度 フィールド データ収集ユニット (FDCU) はこれらのセンサーに接続し、電力を供給し、読み取り値を集約し、データを AWOS サーバーに送信して処理します。
AWOS ソリューションで何を探すべきですか?
AWOS を選択する際、航空専門家は通常、次の点を考慮します。 コンプライアンス – システムはICAOおよびWMOの規制に準拠または認証されていますか?また、現地の規制ニーズに合わせてシステムをカスタマイズできますか?
測定機能 – システムは必要な気象変数をすべて捕捉できますか?
システムの稼働時間の最大化 – システムは、最も必要とされるときに機能するのに十分な信頼性と耐久性を備えていますか?
拡張性 – システムは空港の将来の成長や変化するニーズに適応できますか?
メンテナンスとサポート – 校正、修理、ソフトウェアの更新のためのサービスはありますか?
トレーニング – ベンダーはシステム価値を最大化するためにスタッフ向けのトレーニングを提供していますか?
将来性 – システムは時間の経過とともに新しいテクノロジー、センサー、またはレポート標準と統合されますか? どこに助けを求めればいいのでしょうか?
航空専門家は、信頼性の高い高品質のデータに依存して、運用効率を維持しながら人命と財産に影響を与え、それを保護する重要な決定を下します。
お客様のニーズに最適なAWOSソリューションを選択するのは、特にソフトウェアとハードウェアの両方のコンポーネントが絡む場合は、非常に困難な場合があります。正確なリアルタイムデータを提供し、厳格なコンプライアンス基準を満たしながら、管理と適応が容易なシステムが必要です。そこで私たちの出番です。
Campbell Scientific と提携するべき理由は何ですか?
Campbell Scientificは、完全に統合されたエンドツーエンドのAWOSソリューションを提供することで、システム構築における推測作業を排除します。当社のプラットフォームは、信頼性、柔軟性、そして使いやすさを重視して設計されており、お客様はタイムリーで情報に基づいた意思決定に集中できます。当社の航空チームは、複雑な規制要件に対応できるようサポートとガイダンスを提供します。卓越したサポートを提供することで、あらゆる段階でオペレーショナル・エクセレンスの実現を支援します。
既存のAWOSのアップグレードでも、新しい航空気象ステーションをゼロから構築する場合でも、Campbell Scientificはお客様の成功をお手伝いします。センサー、ソフトウェア、ライフサイクルサービスに至るまで、Campbell Scientificは、包括的でコンプライアンスに準拠した統合型航空気象プラットフォームを提供し、人命の保護と運用の最適化を実現します。
AWOS ソリューションに関して Campbell Scientific とのパートナーシップから何が期待できるかを見てみましょう。
センサー非依存と柔軟性
特定のセンサーセットに縛られることを避けるため、Campbell Scientificのシステムはセンサーに依存しません。つまり、以下のことが可能です。 空港の固有の環境条件に合わせてセンサー スイートをカスタマイズします。
システム全体をオーバーホールすることなく、必要に応じてセンサーを交換またはアップグレードします。
信頼できる社内センサーを使用するか、サードパーティの機器を統合します。 この柔軟性により、AWOS...
続きを読む
著者: Aspen Nielsen | 最終更新日: 06/30/2025 | コメント: 0
AtmosVue™30, のような気象センサーの仕様書を見ると、多くの数字や専門用語が記載されているのが一般的です。例えば、以下のような内容です: 現在の天気出力
背景輝度測定範
動作温度範囲 しかし、これは実際何を意味するのでしょうか?
このブログ記事では、AtmosVue 30 の主な仕様を分析し、その内容を簡単な言葉で説明します
背景
はじめに、AtmosVue 30は3つの独立したセンサー: CS125 現在天気・視程センサ, CS140 背景輝度センサ, and the HygroVue™5 デジタル温湿度センサ で構成されていることをご留意ください。この記事ではAtmosVue 30のスペックシートに関する情報を共有しますが、AtmosVue 30を構成するセンサーのいずれかについて同様の情報をご希望の場合は、下記にコメントをお寄せください。 AtmosVue 30の主な仕様
報告される最大可視性
AtmosVue 30 の場合、報告される最大視程は 100 km (62.1 マイル) です。
報告される最大視程は、現在の気象条件下で、空港にいる人(パイロット、航空管制官、またはその他の航空利用者)が地上 2 メートル(6.6 フィート)の高さで水平にどれだけ遠くまで見通せるかを示します。
背景輝度測定範囲
AtmosVue 30 の場合、背景輝度の測定範囲は 0 ~ 45,000 cd/m 2です。
背景の輝度は、滑走路の照明と背景の空周辺光レベルとのコントラストの強さを理解するのに役立ちます。これは、パイロットが飛行場に着陸するときにどれだけ遠くまで見通せるかを決定する重要な測定値です。
背景の周囲光レベルは、国際照明委員会(CIE)の分光感度を用いて、人間の目で見るのと同じ波長で測定されます。言い換えれば、人間が私たち人間と同じ波長の光を「見ている」ということです。
背景輝度を用いることで、あらゆる光条件、特に低照度または低コントラスト条件における視程計算方法をどのように調整する必要があるかを判断できます。カンデラ/平方メートル(cd/m 2)で測定される背景輝度を、より大規模な計算における他の測定値と組み合わせることで、航空機の視程を決定するのに役立ちます。
現在天気出力
AtmosVue 30 の場合、1 つの出力で 57 個の SYNOP 現在の気象コードと、関連する気象飛行場レポート (METAR) および国立気象局 (NWS) の現在の気象コード、および過去の気象コードが提供されます。
世界気象機関(WMO)は、気象情報を複数の言語に翻訳することなく国際的に伝達するための標準化された手法を開発しました。この通信システムでは、SYNOPと呼ばれる数値コードが一部使用されています。SYNOPコードは一定の頻度(通常は3時間または6時間ごと)で送信され、その地点における現在の重要な気象現象をすべて記述できます。例えば:...
続きを読む
著者: Ajay Singh | 最終更新日: 01/15/2024 | コメント: 0
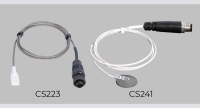
Campbell Scientific’s CS223 Pt-1000 Class A, Back-of-Module Temperature Sensor (discontinued effective 31 October 2023) has been replaced by the CS241 Pt-1000 Class A, Back-of-Module Temperature Sensor. When needed, you can replace the CS223 sensor head with a CS241 head without having to replace the entire...
続きを読む
著者: Ben Todt | 最終更新日: 12/04/2023 | コメント: 0
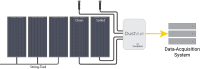
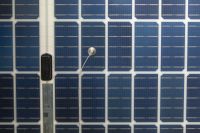
Should you be concerned about the impact of soiling or fouling on your photovoltaic (PV) power plant performance? Did you know that in a recent estimate, more than US$6 billion of annual revenue is lost because of diminished power generation at PV facilities due to...
続きを読む
著者: Jacqalyn Maughan | 最終更新日: 08/22/2023 | コメント: 3
VSPECT®の利点を理解することで、この技術を最大限に活用できるようになります。この記事では、このトピックについて詳しく解説し、より良い測定体験をご提供します。
Campbell Scientific の監視プラットフォームが追加のバイブレーティングワイヤーデータを提供するのはなぜですか?
弊社のVSPECTモニタリングプラットフォーム( CR6、CRVW3、AVW200、VWAnalyzer、またはGranite™ VWire 305 )をご利用になったことはありますか?
これらのプラットフォームを使用して振動ワイヤセンサーを測定していた際、「他社製品のように2つのデータポイントではなく、なぜ6つのデータポイントが表示されるのか」と疑問に思われたかもしれません。ご安心ください!今回は、各データポイントについて詳しく説明し、VSPECTからセンサーについて何がわかるのかを解説します。
これらの製品をまだ使用したことがない場合は、この記事を読むことで VSPECT の利点を理解し、当社の製品とテクノロジーの使用を検討する際に十分な情報に基づいた決定を下すことができます。
サーミスタ抵抗とセンサー周波数
まず、サーミスタ抵抗とセンサー周波数を見てみましょう。これらは、あらゆるデータ収集システムで得られる2つのデータポイントです。
サーミスタ抵抗に関しては、温度に変換してデータ ポイントとして使用したり、バイブレーティングワイヤーセンサーの温度変化を補正したりすることができます。
さて、最も重要なデータポイントであるセンサー周波数を見てみましょう。これは工学単位(圧力、ひずみ、荷重など)に変換され、センサーを取り巻く環境の変化を測定することができます。
VSPECT対応のモニタリングプラットフォームは、単に周波数を読み取るだけではありません。VSPECTはセンサー周波数を読み取り、センサー信号内の競合する周波数から分離することで、最も正確な測定を実現します。VSPECTを使用することで、電力線、近くの重機、水力発電所などの電気干渉源を除去することで、可能な限り再現性の高いデータを取得できます。
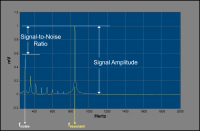
センサー振幅
センサー振幅とは?これは、バイブレーティングワイヤーセンサーのミリボルト応答の二乗平均平方根(つまりセンサー応答の強さ)の測定値です。このデータポイントをセンサーの寿命期間中記録することで、センサーの相対的な健全性に関する概要を把握できます。
例えば、周波数データが不安定であることに気づき、環境がそれほど大きく変化することはあり得ないとわかっている場合などです。センサーを設置した日から今日までのセンサー振幅データをプロットすると、振幅が劇的に減少していることに気づきます。これは、何らかの要因がセンサーの信号強度に影響を与えており、さらなる調査が必要であることを示しています。
ノイズ周波数と信号対雑音比
ノイズ周波数とは、監視プラットフォームが読み取るセンサー信号に影響を与える最も高い電気ノイズ周波数(干渉とも呼ばれます)の振幅のことです。これは、送電線、近くの採掘設備、水力発電所などからの60Hzの干渉が考えられます。また、センサー周波数の整数倍で発生する高調波が原因となる場合もあります。このデータを保存しておくと、センサー測定に影響を与えている干渉源を特定するのに役立ちます。
次に、信号対雑音比(S/N比)を見てみましょう。これは、センサー周波数とノイズ周波数の比です。これは、センサー周囲の電気ノイズが測定にどの程度影響を与えているかを示します。数値が高いほど、ノイズがセンサー信号に与える影響は小さく、数値が小さいほど影響が大きいことを示します。VSPECTは干渉を分離して除去するため、たとえ大きな干渉があっても測定に影響はありません。ただし、他社のモニタリングプラットフォームでは、精度に影響が出る可能性があります。
減衰率
減衰比とは、VSPECTで測定されるバイブレーティングワイヤーセンサーの「リングダウン」のことです。減衰比を時間経過に沿ってプロットすることで、設置後のセンサー環境やセンサー特性の変化を把握できます。これは、センサーの健全性を示すもう一つの指標です。
大きな注意点
このトピックについて議論する際には、覚えておいていただきたい重要な点があります。どのセンサーにおいても、「健全」とみなされる数値や閾値は存在しません。これは、バイブレーティングワイヤーセンサーのメーカーと種類によって異なります。メーカーごとに特性が異なります。つまり、センサーの振幅、信号対雑音比、減衰比など、センサーが正常に機能しているかどうかを判断するための正確な数値や閾値を提示することはできません。しかし、ご安心ください。センサーの検証に役立つデータをご提供し、お客様が自信を持って結果にご満足いただけるよう努めています。
VSPECTを最大限に活用する
当社の VSPECT 対応モニタリング プラットフォーム (CR6、CRVW3、AVW200、VWAnalyzer、および VWire 305) についてお客様にお話しすると、センサーの健全性を確認するために使用されるデータがすでに取得されていることに気付いていないお客様が多くいらっしゃいます。
Campbell Scientific では、あらゆるプロジェクトを成功させるためのツールを提供しており、時の試練に耐えられる長期プロジェクトに携われることに誇りを持っています。 クレジット: Campbell Scientific, Inc. の Michael Adams、Eric Schmidt、Josh Brown がこの記事に貢献しました。
ご質問がある場合は、下記にコメントを残すか、アプリケーション エンジニア ( CSI-Infrastructure@campbellsci.com ) または営業チーム メンバー ( infra-sales-na@campbellsci.com ) までご連絡ください。
続きを読む
著者: Jacqalyn Maughan | 最終更新日: 04/06/2023 | コメント: 0
振動ワイヤセンサーの測定値が不良なのは、データの不規則性や誤りが原因だと思ったことはありませんか?データの問題が原因ではないかもしれないと知ったら、驚かれるかもしれません。Campbell ScientificのVSPECT®製品ファミリー(CR6, CRVW3, AVW200, and VWAnalyzer)以外のデータ収集システムをご使用の場合、測定値の不良はデータ収集システムの脆弱性が原因である可能性があります。
VSPECT:優れた測定技術
Campbell Scientificでは、センサーが損傷し交換が必要だと考えるお客様から多くのご相談をいただいています。交換は費用と労力がかかる可能性があるため、確実な判断のためにセカンドオピニオンと検証をご希望でした。Campbell Scientificの測定技術を搭載したVSPECTは、センサーの故障か、既存のデータ収集システムが誘導電気干渉の影響を受けているかを判別し、誤ったデータや不安定なデータの原因となる可能性があります。
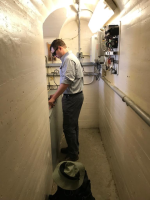
先日、ある見込み顧客を訪問し、ハンドヘルドVWAnalyzerを用いて、問題がセンサーに起因するものか、それとも他の原因によるものかを調べました。このケースでは、センサーの故障ではなく、データ収集システムの測定性能不足が原因であることが分かりました。このお客様は、グラウト充填されたピエゾメーターとひずみゲージの交換が必要ないことにご満足いただけました。交換すると、100万ドル以上の人件費と時間がかかっていたはずです。
VSPECT は、あらゆる電気的干渉の中から共振センサー周波数を識別します。
重要な監視ネットワークには、正確で再現性の高いデータが必要です。VSPECTの特許取得済み測定およびデジタル信号処理アルゴリズムは、バイブレーティングワイヤーセンサーの基本周波数を正確に特定しながら、あらゆる電気的干渉を排除します。測定から電気的干渉(送電線、水力発電、高周波溶接機、建設機械、電気鉄道などによるもの)を除去することで、精度と分解能の両方が向上します。
CR6 などの VSPECT 対応 Campbell Scientific データ収集製品は、測定から電気的干渉を除去するだけでなく、数十年にわたってセンサーのパフォーマンスを追跡するための診断データを測定して保存できます。 クレジット: Campbell Scientific, Inc. の Michael Adams、Eric Schmidt、Josh Brown がこの記事に貢献しました。
ご質問がある場合は、以下のコメント欄にご記入の上、弊社の営業チームおよびアプリケーション エンジニアまでお問い合わせください。
続きを読む
著者: Nathanael Wright | 最終更新日: 03/28/2023 | コメント: 0
Campbell Scientificのバイブレーティングワイヤー測定ハードウェアは、特許取得済みのVSPECT®テクノロジーを採用しており、他のあらゆるバイブレーティングワイヤー測定システムに対して明確な優位性を提供します。他社製のバイブレーティングワイヤーインターフェースはパルスカウントを用いてバイブレーティングワイヤー周波数を導出しますが、Campbell ScientificのVSPECTバイブレーティングワイヤー測定製品はスペクトル解析を用いてセンサーの共振周波数を特定し、干渉や競合周波数を除去することで、優れた測定結果を提供します。
優れた技術をもってしても、「センサーが反応しない?配線が切れたり壊れている?干渉が激しい?」といった質問に答えるのが難しい場合があります。
これらの質問に答えるために、測定値を確認するために使用する 6 つのパラメータを以下に示します。 センサー周波数
振幅
信号対雑音比
ノイズ周波数
減衰率
サーミスタ 当社のVSPECTバイブレーティングワイヤー測定製品はすべて、これらの値を読み取ることができます。CR6, CRVW3, Granite™ VWire 305, AVW200 , VWAnalyzerなどです。本稿では、ダウンロード可能な Device Configuration Utilityを搭載したCR6データロガーを使用します。
まず、Device Configuration Utilityを使用してデータロガーに接続します。接続後、一番上の行にある「VW Diagnostics」タブを選択します。 下の画像はVW Diagnostics タブです。中央には、これから使用する診断値を入力する6つのフィールドがあります。ピーク周波数(センサー周波数)、ピーク振幅(振幅)、信号対雑音比、ノイズ周波数、減衰率、サーミスタです。診断テストを実行すると、これらのフィールドの上下のスペースにグラフが表示され、情報を視覚的に把握するのに役立ちます。 CR6が測定を行うと、2つのグラフと6つのフィールドの情報が自動入力されます。データロガーに設定されている測定間隔によっては、データロガーが測定を行うまでに遅延が発生する場合があります。その場合は、データをファイルに保存し、後でダウンロードできるようにデータロガーを設定してください。このファイルは、技術者に解析の支援を依頼する場合にも役立ちます。
では、そのプロセスを見ていきましょう。
まず、ウィンドウの右下にある「SetUp」をクリックします。VW診断セットアップウィンドウが表示されます。 CR6で診断ファイルを生成するように設定するには、「VW Diagnostic Variable」ドロップダウンボックスをクリックし、適切なファイル名を選択します。「VW Drive」ドロップダウンボックスで、ファイルを保存するデータロガーのストレージドライブを選択します。
注: これら 2 つのフィールドは事前に入力されていますが、 [OK]ボタンが使用可能になる前に、有効なファイル名と場所を入力するなど、各フィールドで選択を行う必要があります。 「OK」をクリックします。データロガーはセンサーを測定し、画面にデータを表示し、データロガーのファイルシステムに保存します。測定が完了すると、選択したドライブにファイルが書き込まれ、ファイル名がFile Controlに表示されます。 このファイルは、File Control 経由でダウンロードするか、 VW Diagnostics タブから[Save These Results(これらの結果を保存)]または[Export(エクスポート)]をクリックしてエクスポートすることができます。 「Save These Results(これらの結果を保存する)」を選択した場合は、ファイルを後で見つけやすい場所に保存してください。ファイルの末尾に.vw拡張子が付いていることに注意してください。このファイルには、ライブウィンドウに表示されるものと同じスペクトルと時系列データが含まれており、Device Configuration UtilityのVWオフライン解析モードを介してどのコンピュータでも開くことができます。 または、「Export」をクリックすると、別の種類のファイルを保存するように求められます。必ず分かりやすい場所に保存してください。ファイルの末尾に.txt拡張子が付いていることに注意してください。このファイルは後でテキストエディタで開き、CR6の測定値を確認できます。 診断から得られる情報を最大限に活用するには、毎回両方のファイルを保存することを検討してください。ただし、このブログ記事では、オフラインモードでグラフ化されたデータを確認できるように、.vw 拡張子のファイル(Save These...
続きを読む
著者: Dirk Baker | 最終更新日: 07/29/2022 | コメント: 9
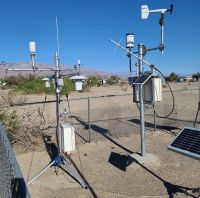
About a year ago (May 2021), I installed a weather station next to the National Weather Service’s (NWS) official station at Furnace Creek in Death Valley National Park (California, USA). To familiarize yourself with this project, read my previous article. The purposes of this installation...
続きを読む
著者: Jacob Davis | 最終更新日: 06/13/2022 | コメント: 0
As you may know, it can be quite challenging to perfectly align the north mark of a wind direction sensor with true north. For example, when you’re on a ladder handling tools or hanging on a tower, you don’t have a spare hand to hold...
続きを読む
著者: Libbie Anderson | 最終更新日: 05/05/2022 | コメント: 0
At Campbell Scientific, we redesigned our back-of-module temperature sensors and launched the CS241 and CS241DM purpose-built sensors to optimize performance on bifacial photovoltaic (PV) modules and help you collect data as precisely as possible. These newer sensors have some similarities to our previous sensor models, but...
続きを読む
著者: Dirk Baker | 最終更新日: 06/21/2021 | コメント: 6

In this article, I'll share my experience collaborating on a research project to record some extreme weather conditions that may even set a world record!
On August 16, 2020, the weather station located at Furnace Creek in Death Valley National Park (California, USA) recorded a temperature...
続きを読む
著者: Dirk Baker | 最終更新日: 03/05/2021 | コメント: 0
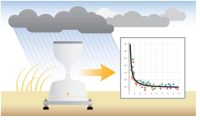
In this article, I’ll explain how errors can occur when measuring the precipitation amount, discuss a correction approach, and demonstrate how an algorithm can be used to design high-quality tipping bucket rain gauges.
Introduction
Liquid precipitation (rain) is at once one of the simplest measurements mechanically and...
続きを読む
著者: Ajay Singh | 最終更新日: 10/13/2020 | コメント: 0
When we are faced with challenges, there is often an opportunity for improvement. In this blog article, learn how our engineers redesigned our back-of-module (BOM) temperature sensor to resolve specific challenges that impacted the quality of bifacial solar photovoltaic (PV) panel performance monitoring.
Bifacial PV panels...
続きを読む
著者: Mike Nelson | 最終更新日: 09/08/2020 | コメント: 0
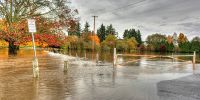
There are times during major weather events when we may hear the news reporter indicate the local river is expected to crest in the next 12 hours at an estimated stage level.
What is a crest and a stage level, and how do they affect me?
Basically,...
続きを読む
著者: Dirk Baker | 最終更新日: 01/30/2020 | コメント: 2
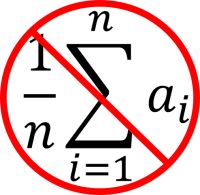
Have you ever been told not to average relative humidity (RH)? Have you ever created a data logger program with Short Cut and noticed that it does not allow you to average RH when you generate your data table? Do you know why?
In this blog...
続きを読む
著者: Andrew Sandford | 最終更新日: 01/06/2020 | コメント: 0
Imagine that you already have a winning sensor that has sold more than 15,000 units. As time passes, you realize that technology has evolved, but your sensor hasn’t. If you are objective in your product evaluation, you may determine that there is justification for the...
続きを読む
著者: Robin Deissinger | 最終更新日: 11/19/2019 | コメント: 0
Are you ready to get heated? In this interview, Hayden Mahan, Product Manager of the Gas Flux and Turbulence Group, shares his excitement about our heated sonic anemometer (the new CSAT3BH) and why heat matters. Hayden was interviewed by Robin Deissinger, the blog editor. Interview...
続きを読む


